Part 05. Design System Benefits Case
Now the exciting part, pulling this all together, clearly and succinctly! We will be collating all the work you have been developing from the previous articles of this series, modelling the commercial benefits and packing the whole narrative into our pitch!
This is part one of a five-part series dedicated to building a Design System business case.
Feel free to visit any of the series:
Packaging the Narrative
Each organisation is different in how it pitches for and releases funding in determining cadences with defined business cases; however, if you need, feel free to use these two vanilla versions I have developed to get you started.
You can duplicate the templates below; however, you will likely need instructions and assistance on using them as some heavy formula and sheet references run both templates.
Note: All content is, for example, purposes only and hypothetical. I suggest you update with your organisation's specific information (e.g. roles, rates, discounted cash flow, etc.)
Benefits Case Modelling
A google sheet to help bring a commercial lens to your benefits realisation.
Business Case Presentation
A google sheet to help wrap up your design system narrative ready to pitch
Benefits Case Modelling
In this scenario, we will be using IRR (internal rate of return), EPP (Estimated payback period) and NPV (Net present value). It's improbable your organisation would use all metrics for financial analysis to estimate the profitability of potential investments.
It's worth noting your models will need modifications over time. IRR does not account for changing discount rates, so it's not adequate for longer-term projects with discount rates that are expected to vary. Unlike the IRR, a company's NPV, or net present value, is expressed in a dollar figure. It is the difference between a company's present value of cash inflows and its present value of cash outflows over a specific period. Design systems that likely require some significant refactoring every couple of years reflected over long time horizons.
Given that your discount rates are likely to change substantially over time and IRR does not consider the changing discount rates, you will be left with an inaccurate estimated profitability measure. But each organisation is different. Use whatever your commercial modellers use internally to determine profitable investments.
See the instructions below to leverage the benefits case modelling template:
00. Cover - It all starts here! Select the 'Start Month' of your initiative in the dropdown. This input will update related sheets' Capital Expenditure', 'Benefits' and 'ByMonth' to reflect a 5-year engagement from your decided month. Which inevitably is required to determine your investment summary over time in the 'Summary' final tab.

0.1 Roles - You will see an example of roles, daily $ and assumed capital recovery rates purely hypothetical. Update to reflect your organisation's information. This table is used in almost every other sheet to reference the related information from one location (e.g. Capital expenditure = resource profile vs roles daily $).

In the article, Part 04. Design System Roadmap & Horizons you should have an idea of the scope you're intended to initiate with and what your delivery strategy entails, whether its initial build to mature into a federated model or keep a persistent centralised design system team. Whatever the approach, it will present an estimated capacity to deliver the loaded estimates.


1.0 Resource Profile - This tab reflects the assumed capacity you require to support the scope you’re intended to initiate. The date of the engagement will update per the cover month you selected. See the ‘data validation‘ is a v-lookup of the ‘Roles’ tab.
Step 1.1: Add your phases of deliverables. They can be epics or features. ; however, you want to slice it.
Step 1.2: Add the roles required to realise your estimated phases of deliverables. See here in the ‘data validation the roles are referencing the hidden ‘Roles’ tab via a v-lookup. This is important as it associates the rates of that role from a single location.
Step 1.3: Add the assumed capacity required under the monthly views (e.g. 1 = 100% capacity, 0.6 = 60% capacity). These numbers will sum into yearly and full engagement totals.

2.0 Capital Expenditure - The ‘Capital Expenditure’ tab reflects the ‘Resource Profile’ tab capacity in dollar terms (e.g. Product Owner at 60% capacity at Daily $ = X Monthly expenditure)
Step 2.1: You shouldn’t have to do anything to this tab other than possibly add more rows if your plan is extensive. If you add other rows, simply select the row about ‘Total Capital Expenditure’ and drawdown to copy the formula further through your sheet.
In the article ‘Part 01 - Design System Problem Space’, we discussed some examples of hard and soft metrics to gather (e.g. increasing team velocity %). And in ‘Part 02 Design System Market Landscape’, we referenced some industry cases studies (e.g. IBM iX design team saw a 50% increase in workflow efficiency…). It’s time now to bring all the information you have gathered and start building some hypotheses. You will also need to figure the total cost of the teams you expect to adopt your design system to leverage the benefits.

3.0 Hypothesis / Assumptions - Here, we will model your assumed benefits. In this example, for the sake of simplicity, we are looking at saving time and enabling velocity gains, essentially delivering more scope for less overall spend. In this example, we see two programs forecasted to adopt the design system into their ways of working (Program 01 of 6 scrum teams and Program 02 of 2 scrum teams).
Step 3.1: Update your program and/or team profiles. The ‘Total Headcount’ references are summing the headcount references noted in each of the scrum teams.
Step 3.2: The ‘Total Headcount’ is then reflected in an averaged scrum team headcount, and utilising the daily $ and capital recovery rates again from the ‘Roles’ tab, we can sum the average sprint cost of a single sprint to use as a unit moving forward.
Now we want to model the size of the cost of the problems. In our example, we assume velocity benefits per role differ between Design Token development, Web Component and Pattern development, and lastly, maintenance reductions. The % impacts are averaged across all roles into an amalgamated benefit per problem space, with further assumptions that after further development and adoption, we will see the growth of benefits over time. Each of the example problems is then averaged into a % cost of delay over the five years.


Step 3.3: Add your benefit assumptions in. If you are referencing velocity gains, leverage your project management (e.g. Jira) information for benchmarks. Alternatively, you could start alternate models of benefit (e.g. offshore enablement = reduction in onshore headcount, etc.)
Step 3.4: Average the total benefits into the 'Average Problem Percentage' table
Step 3.5: Next, we want to assume the adoption rate of the design system. over the five years. Remember, adoption is critical to the success of design systems!
Step 3.6: Update the 'Program 0X - Average Problem Cost' tables. Referencing each role, the daily $ versus the averaged % of the problem is noted in the 'Average Problem Percentage' table. Total these into your' Portfolio - Average Problem Cost' table.
Step 3.7: We assume there are '20' workable sprints (2-week intervals) a year.
Step 3.8: We sum the average cost of the total portfolio per month versus the average cost of the problem per month. And now we want to flip the problem cost into opportunity enablement. And leverage the Adoption rate %.

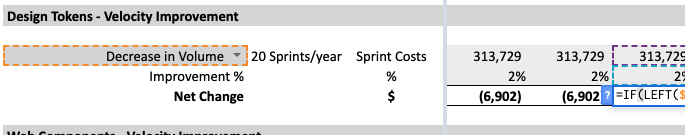
04. Benefits - Here, we want to consider the ‘Resource Profile’ tab when the design system can be adopted per your modelling in the ‘Hypothesis / Assumptions’ tab. You will see the reference of each of the benefits resulting in a month by month Net Change.
Step 4.1: Reference your Hypothesis tab total portfolio cell calculating the average cost per sprint versus the adoption rate.
Step 4.2: Reference your Hypothesis tab averaged total improvement % cell into the related year assumptions.
Step 4.3: Pending on your modelling, your % volume will be a positive or negative multiplier. In this example case, we present efficiency gains and maintenance reduction as a reduction in sprint costs.


05. By Month - The 'Net Change' in benefits is reflected in our 'By Month' tab. However, we can quantify the incremental capital expenditure against the benefits realisation whilst calculating all our requirements for the later IRR, EPP or NPV. Here update your organisation's DCF (Discounted cash flow is an analysis method used to value investment by discounting the estimated future cash flows rate, essentially to the cost at which your organisation can acquire cash). For this example, you will see the value '1.058'.
Step 5.1: Ensure your benefits references refer to your Benefits tab 'Net change' values of each benefit hypothesis.
Step 5.2: Update your organisations DCF value.

06. IRR and Estimated Payback Period - And finally, your summary view! In this view, we see the summary of capital expenditure, benefits realisation, EBITDA, and DCD required to calculate our IRR, EPP, or NPV. Your organisation will have criteria (e.g. funds won't be realised to initiatives that don't have a payback period under 3 years); whatever your criteria are, understand it. You will undoubtedly be a trigger to redesign your resource profile and how you intend to release benefits to your organisation.
Step 6.1: Sit back and check out the epic benefits your design system will provide your organisation. Providing confidence as a profitable future investment is worth your organisation's funding, time and effort.
If you’re a designer, then that was outside your comfort zone. Remember not to treat the benefits case modelling as an accurate estimate or a source of truth for your benefits case. Your organisation will approach investment decisions their way. What’s important is that you consider the impact of your resourcing profile, assumed scope and adoption strategies with a commercial mindset. Now let’s pull together the narrative!
02. Business Case Presentation
Packing your story together needs to do two things. The executives you pitch to will require you to tell a story that deserves hours of context in about 15-20min. For your wider design system audiences, you need a robust vision relevant for the different cohorts of maker specialists and adopting parties.
Above, you will see 'Business Case Presentation' google slides filled with examples. Feel free to use this as a springboard for your own story. Starting with your:
Vision Statement - Providing an inspiration desire to achieve something in the long-term. Framing the direction of your narrative.
Problem Space - Presenting context to your organisation's current state. Pain points present opportunities in your environment that design systems can enable.
Roadmap & Horizons - The Roadmap reflects your tangible delivery approach to executing on your intended scope. This should reflect the 'resource profile' and 'capital expenditure' from the 'Design System Benefits Case'.
Benefits Case - A summary of your modelling from the 'Design System Benefits Case' highlighting your benefits methodology and investment opportunities.
Market Landscape - What direction is the market taking today for you? I've provided some basic examples. However, it would be in your best interest to add examples of competitors relevant to your industry or organisation.
Appendix Items - I've thrown a few random slides in there to provide more context if required to some of the topics we've covered in this article series.

Composing a traditional business plan can be overwhelming, and many find it challenging to craft it. However, it doesn't need to be that way. A simple method to begin it is by writing an executive summary.

When you're trying to sell an idea to a potential investor, you'll need to craft the pitch-perfect executive summary. Here's how to write one that will get your business plan read and your foot in the door.

We hear more and more that organizations must have a compelling "purpose", — but what does that mean? Aren't there already a host of labels out there that describe organizational direction? Do we need yet another?
That's the finish of the design system benefits case series. I truly hope it was valuable for you and you enjoyed the read! From problem space to market landscape, identifying the possible scope and wrapping all our accumulated knowledge into a benefits case narrative that hopefully results in an exciting adventure ahead of you! Now in the immortal words of He-Man, “I have the power!” No go forth seed, nurture and scale your Design System

You can review all previous articles here